Stop paying tokens for grep: compiler-accurate call graphs for AI agents
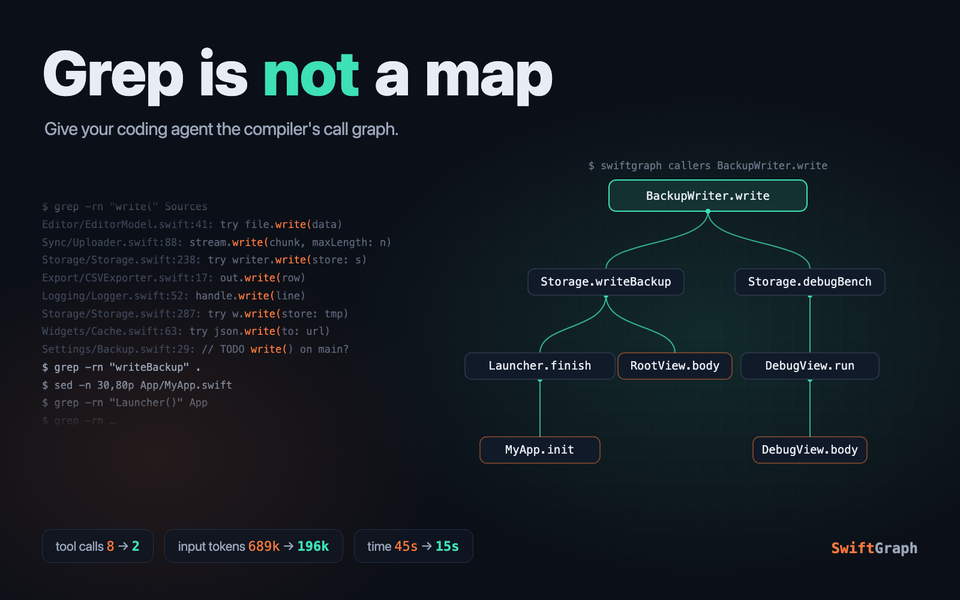
Do you ever watch your coding agent answer "who calls this?" and count the tool calls? Grep, open a file, grep again, open another file, grep one more time. It gets there. Eventually. For me, this is less than an optimal way to go, and I have numbers to show why.
The problem
Agents don't know your code. They know text. When you ask Claude, Cursor or any other agent "who ends up calling this method?", it does what a cave person would do! It searches for the name, reads the lines around each match, figures out which function it is in, and searches for that name. One hop up the call stack costs at least two tool calls.
And every tool call is a round trip. The agent sends the whole conversation again: the system prompt, your question, every grep result so far. Ten tool calls means reading the same context ten times.
Text search has another problem. It doesn't know Swift. write( is just six characters. It doesn't know which write you mean, which overload the compiler picked, or that a call through a protocol lands in your type. The compiler knows all of that. It even writes it down for you, in the index store, every time you build in Xcode.
So why doesn't the agent ask the compiler?
The fix
That's exactly what SwiftGraph does. It reads the index store Xcode already produces, turns it into a call graph and saves it as a plain text file in your repo. The agent skill teaches the agent to ask the graph before it greps:
swiftgraph callers <symbol>     # who calls / reads / writes it, transitively
swiftgraph callees <symbol>     # what it calls / reads / writes, transitively
swiftgraph find <text>          # not sure of the name?
One call, a whole tree, every line a file:line call site. No guessing.
The test subject
Talk is cheap, so I ran an experiment. My test subject is one of my side projects: a SwiftUI app with about 140,000 lines of Swift and a local package with dozens of feature modules. Real code, real mess:)
First things first, the graph:
swiftgraph index
wrote .swiftgraph/graph.local.txt: 10923 symbols, 45609 edges
About 7 seconds, from the DerivedData that was already there. No extra build.
Next step, pick a call stack. I took the method that writes a backup of the database (names changed, structure is real). The question for both agents:
Find every production (non-test) call path that ends up calling BackupWriter.write(store:). Trace upward until you reach the top of each chain.Then I started two agents, both Sonnet, same prompt. One got the SwiftGraph skill. The other got a strict rule: grep, find and read only, no graph.
The results
Both found the same answer. Here is what the graph agent saw, in one query:
BackupWriter.write(store:)  [instanceMethod]  Sources/Storage/BackupWriter.swift:90
├─ called by Storage.writeBackup(store:)  Sources/Storage/Storage.swift:238
│  ├─ called by Launcher.finishLaunch(store:)  App/MyApp.swift:70
│  │  ├─ called by Launcher.init()  App/MyApp.swift:37
│  │  │  └─ called by MyApp.init()  App/MyApp.swift:122
│  │  └─ called by Launcher.openInBackground()  App/MyApp.swift:45
│  │     └─ called by Launcher.init()  App/MyApp.swift:34  … (see above)
│  └─ called by RootView.body  App/RootView.swift:146
└─ called by Storage.debugBenchmarkBackup(store:)  Sources/Storage/Storage.swift:287
   └─ called by BenchmarkDebugView.runBenchmark()  Sources/Settings/DebugSheet.swift:162
      └─ called by BenchmarkDebugView.body  Sources/Settings/DebugSheet.swift:109
That's it! The grep agent built the same tree by hand: grep for the type, read the file, grep for the wrapper function, read the app entry point, grep for the init, read more lines. Eight shell calls.
The numbers:
| With graph | Grep only | |
|---|---|---|
| Tool calls | 2 (read the skill, run one query) | 8 |
| Model turns | 3 | 10 |
| Input tokens processed (all turns) | ~196k | ~689k |
| Output tokens | 899 | 2,673 |
| Wall time | 14.5 s | 44.9 s |
| Correct answer | yes | yes |
3.5x fewer input tokens, 3x faster, a quarter of the tool calls. And 2 of the graph agent's calls are a one-off: reading the skill. Every next question in the same session costs one call.
Why the token count looks similar at first
Here's the trap. If you only look at the agent's final context, both look the same: about 69k vs 74k tokens. Around 60k of that is the system prompt and tool definitions, before the agent does anything.
The real cost is what gets processed on every turn. The grep agent took 10 turns, so it re-read that ~70k context 10 times. The graph agent did it 3 times. Prompt caching makes re-reads cheaper, so your bill won't drop by the full 3.5x, but your wait time and your rate limits feel all of it.
Let's be honest
Grep did fine here. Why? The type name was unique. Search for BackupWriter, and there are only a few matches. The grep agent was smart and searched for the type first.
It even added things the graph doesn't have. It read the code around each call, so it noticed that the launch path runs only under a condition and that the benchmark lives behind #if DEBUG. It also went one level higher, to the settings screen that presents the debug sheet. The graph stops at a SwiftUI body, because SwiftUI calls body, not your code.
So the graph is a map, not the territory. You still open the files you care about. You just don't need eight tool calls to find out which files.
Now imagine the hard version:
- The method has a common name.
write(matches 56 lines in 18 files in this project. Every feature has its own view model with its ownsave(). - The call goes through a protocol. Grep finds the requirement, not the conformance the compiler dispatched to.
- You want who writes a property, not who reads it. Good luck telling
profile.name =fromprofile.name ==with a regex.
Each of these turns 8 grep calls into 20. The graph answers in one, with via protocol and written by right in the tree.
What it can't see
Only links the compiler records. NotificationCenter, selectors, KVO, SwiftUI @Environment injection and reflection don't show up. The skill says so, and tells the agent to grep for those. Grep is still a great tool, it just shouldn't be the first tool.
Conclusions
Your agent doesn't need to read your code like a text file. The compiler already did the hard work, for free, on every build. Give the agent the map and let it spend its turns on the actual task:)
SwiftGraph is open source, works as a Claude Code plugin or a plain CLI. If you like my idea, use it. Available here: SwiftGraph on GitHub
Happy coding!